


Half of all eCommerce brands operate below a 2:1 ROAS ratio right now, while the top quartile runs at 4:1 and above. The average sits at 2.87:1 across the industry, but that number hides massive variation by vertical and business model.
If you’re aiming to join that top-performing group, you are in good company. We will show you return on ad spend benchmarks by industry and platform.
We will also share the 7 factors that determine your real target and a 30-day sprint for moving your number out of the middle of the pack. The eCommerce funnel optimization context sitting beneath and above the ad click shapes what ROAS you can actually sustain so that's the frame we'll use throughout.
What Is Return on Ad Spend and Why Your Benchmark Sets Your Strategy
Return on ad spend (ROAS) measures revenue generated per dollar spent on advertising.
The formula:
Revenue from Ads ÷ Ad Spend = ROAS.
Spend $10,000 on ads, generate $40,000 in revenue, your ROAS is 4:1. Clean and simple.
That number alone tells you almost nothing, though. A 4:1 ROAS is profitable for a brand running 40% contribution margins. The same ratio is a money pit for a brand operating at 15% with high fulfillment costs and a single-purchase customer base.
Benchmarks solve this by providing the comparison your raw number can't give you: how does your vertical actually perform, what do top-quartile brands hit in your category, and where does your current ROAS rank inside that range?
By the Numbers
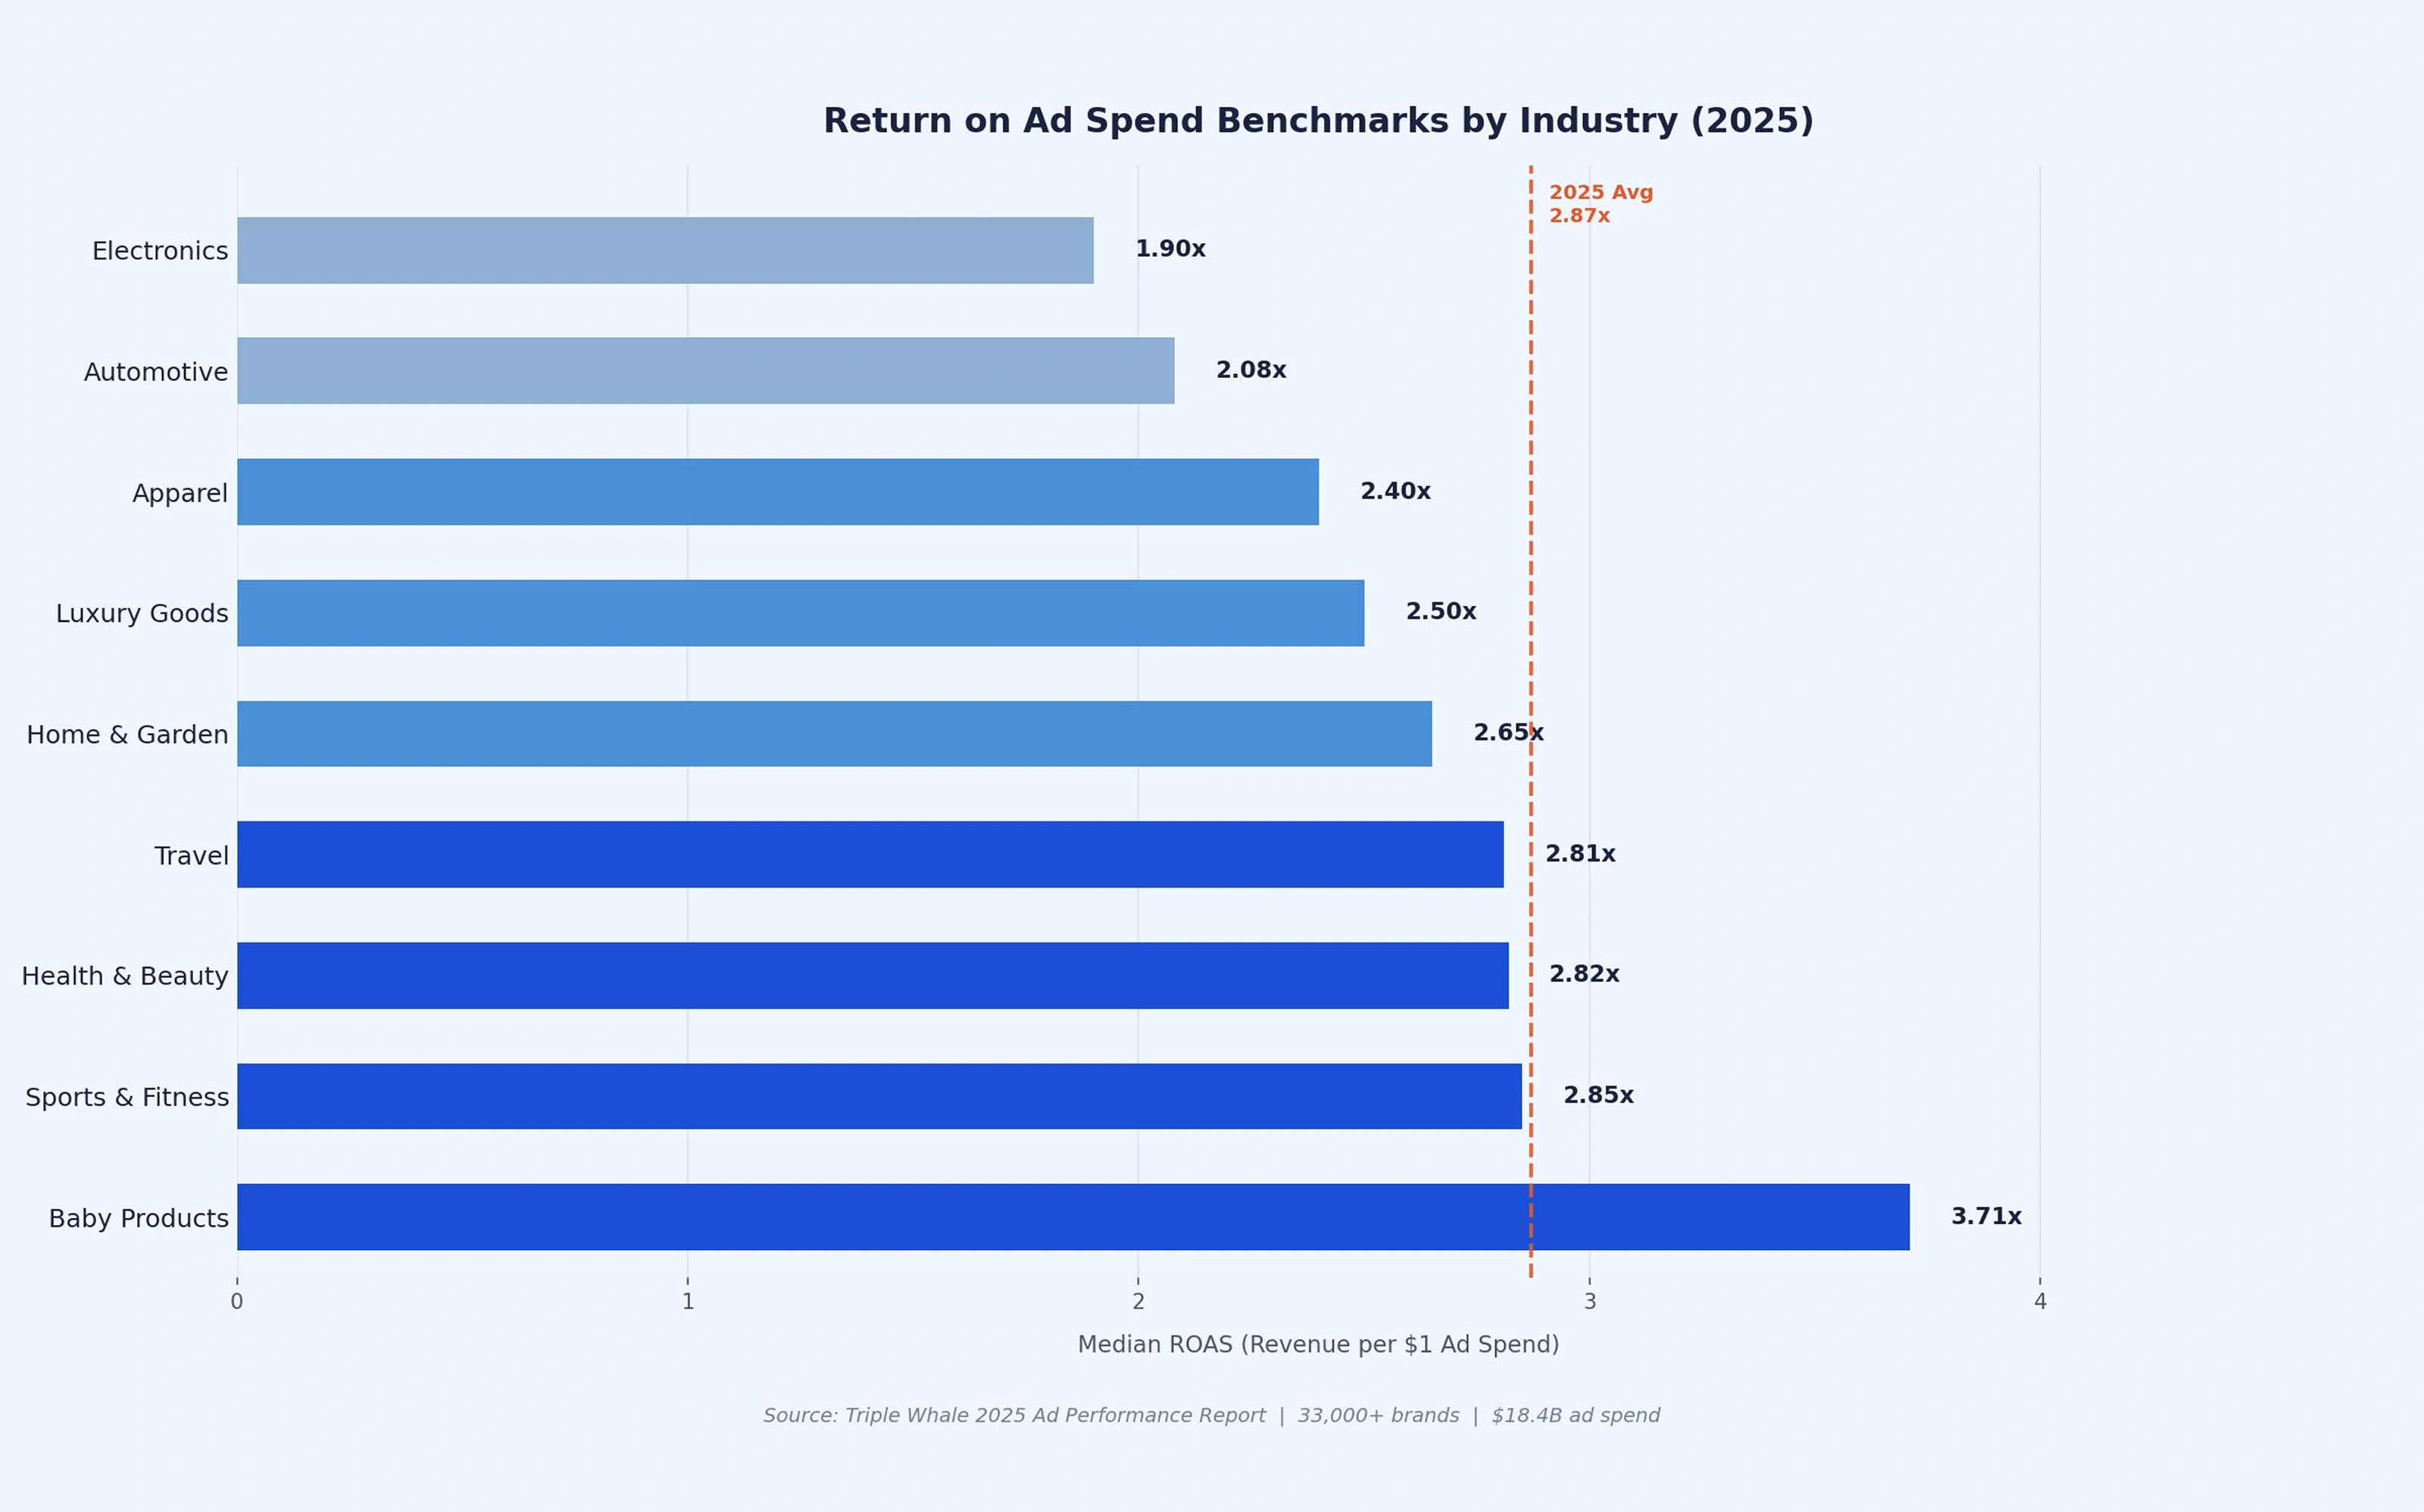
The median ROAS across eCommerce in 2024 was 2.04 — meaning half of all eCommerce brands generated less than $2 for every dollar in ad spend. The 2025 average landed at 2.87:1, down from prior years as ad costs continue climbing.
Return on Ad Spend Benchmarks by Industry in 2025
Category matters more than almost anything else when interpreting ROAS. A baby products brand and an electronics retailer operating at the same ROAS number are in completely different financial positions.
Here are ROAS benchmarks for different industries:
Sources: calc4marketers.com and roas-calculator.org
Luxury products lead because buyers in this category are less price-sensitive and more focused on exclusivity and brand perception. Higher margins and larger average order values give campaigns more room to stay profitable even with premium acquisition costs.
Mobile apps and gaming are lower because monetization depends heavily on retention and long-term user value. User acquisition is highly competitive, and large volumes of low-intent installs can quickly reduce return on ad spend.
The Home & Garden category shows something worth understanding. High-AOV products with deep feature differentiation can sustain ROAS ratios well above the vertical median because a single transaction carries more revenue than a repeat-consumable purchase. And buyers tend to convert once they find a feature set that matches what they already want.
Brondell’s Swash 1400 bidet seat illustrates this pattern. Buyers searching for a heated-seat bidet with a warm air dryer and an LED nightlight have already decided on the category and are looking for the spec match.
At that point, the purchase decision shifts from category exploration to feature matching. Heated seat, adjustable water pressure, warm air dryer, deodorizer, and nightlight are not discovery points anymore. They are requirements the buyer is actively trying to check off.
That is where performance changes. A product page that clearly maps each feature to search intent reduces friction in the decision process. It filters out low-intent traffic early and pulls in users who are already comparing final options. That tighter alignment between intent and product detail helps lower acquisition cost pressure and supports stronger ROAS compared to broader, less specific campaigns.
Common Mistake
Don't compare your ROAS against the full industry average of 2.87x. Find category-specific data. A sports nutrition brand should benchmark against other DTC supplement brands – not against the broader health & beauty median.
This difference becomes obvious in supplement categories that are search-driven and compound-specific. Take buyers searching for Tongkat Ali supplements at Nootropics Depot. These users are not browsing general wellness products. They already know the ingredient, after reading research threads, dosage discussions, or comparisons across a few trusted suppliers.
By the time they land on a product page, the decision is mostly shaped. The remaining step is validation – purity, standardization, testing transparency, dosage form. That changes how performance behaves. Clicks from these searches tend to carry higher intent and stronger conversion efficiency compared to broad terms like “energy supplements” or “testosterone boosters.”
This is also why cross-industry ROAS benchmarks break down fast. A general health & beauty median includes impulse beauty buys and high-volume retail behavior. None of that reflects how ingredient-led supplement buyers act.
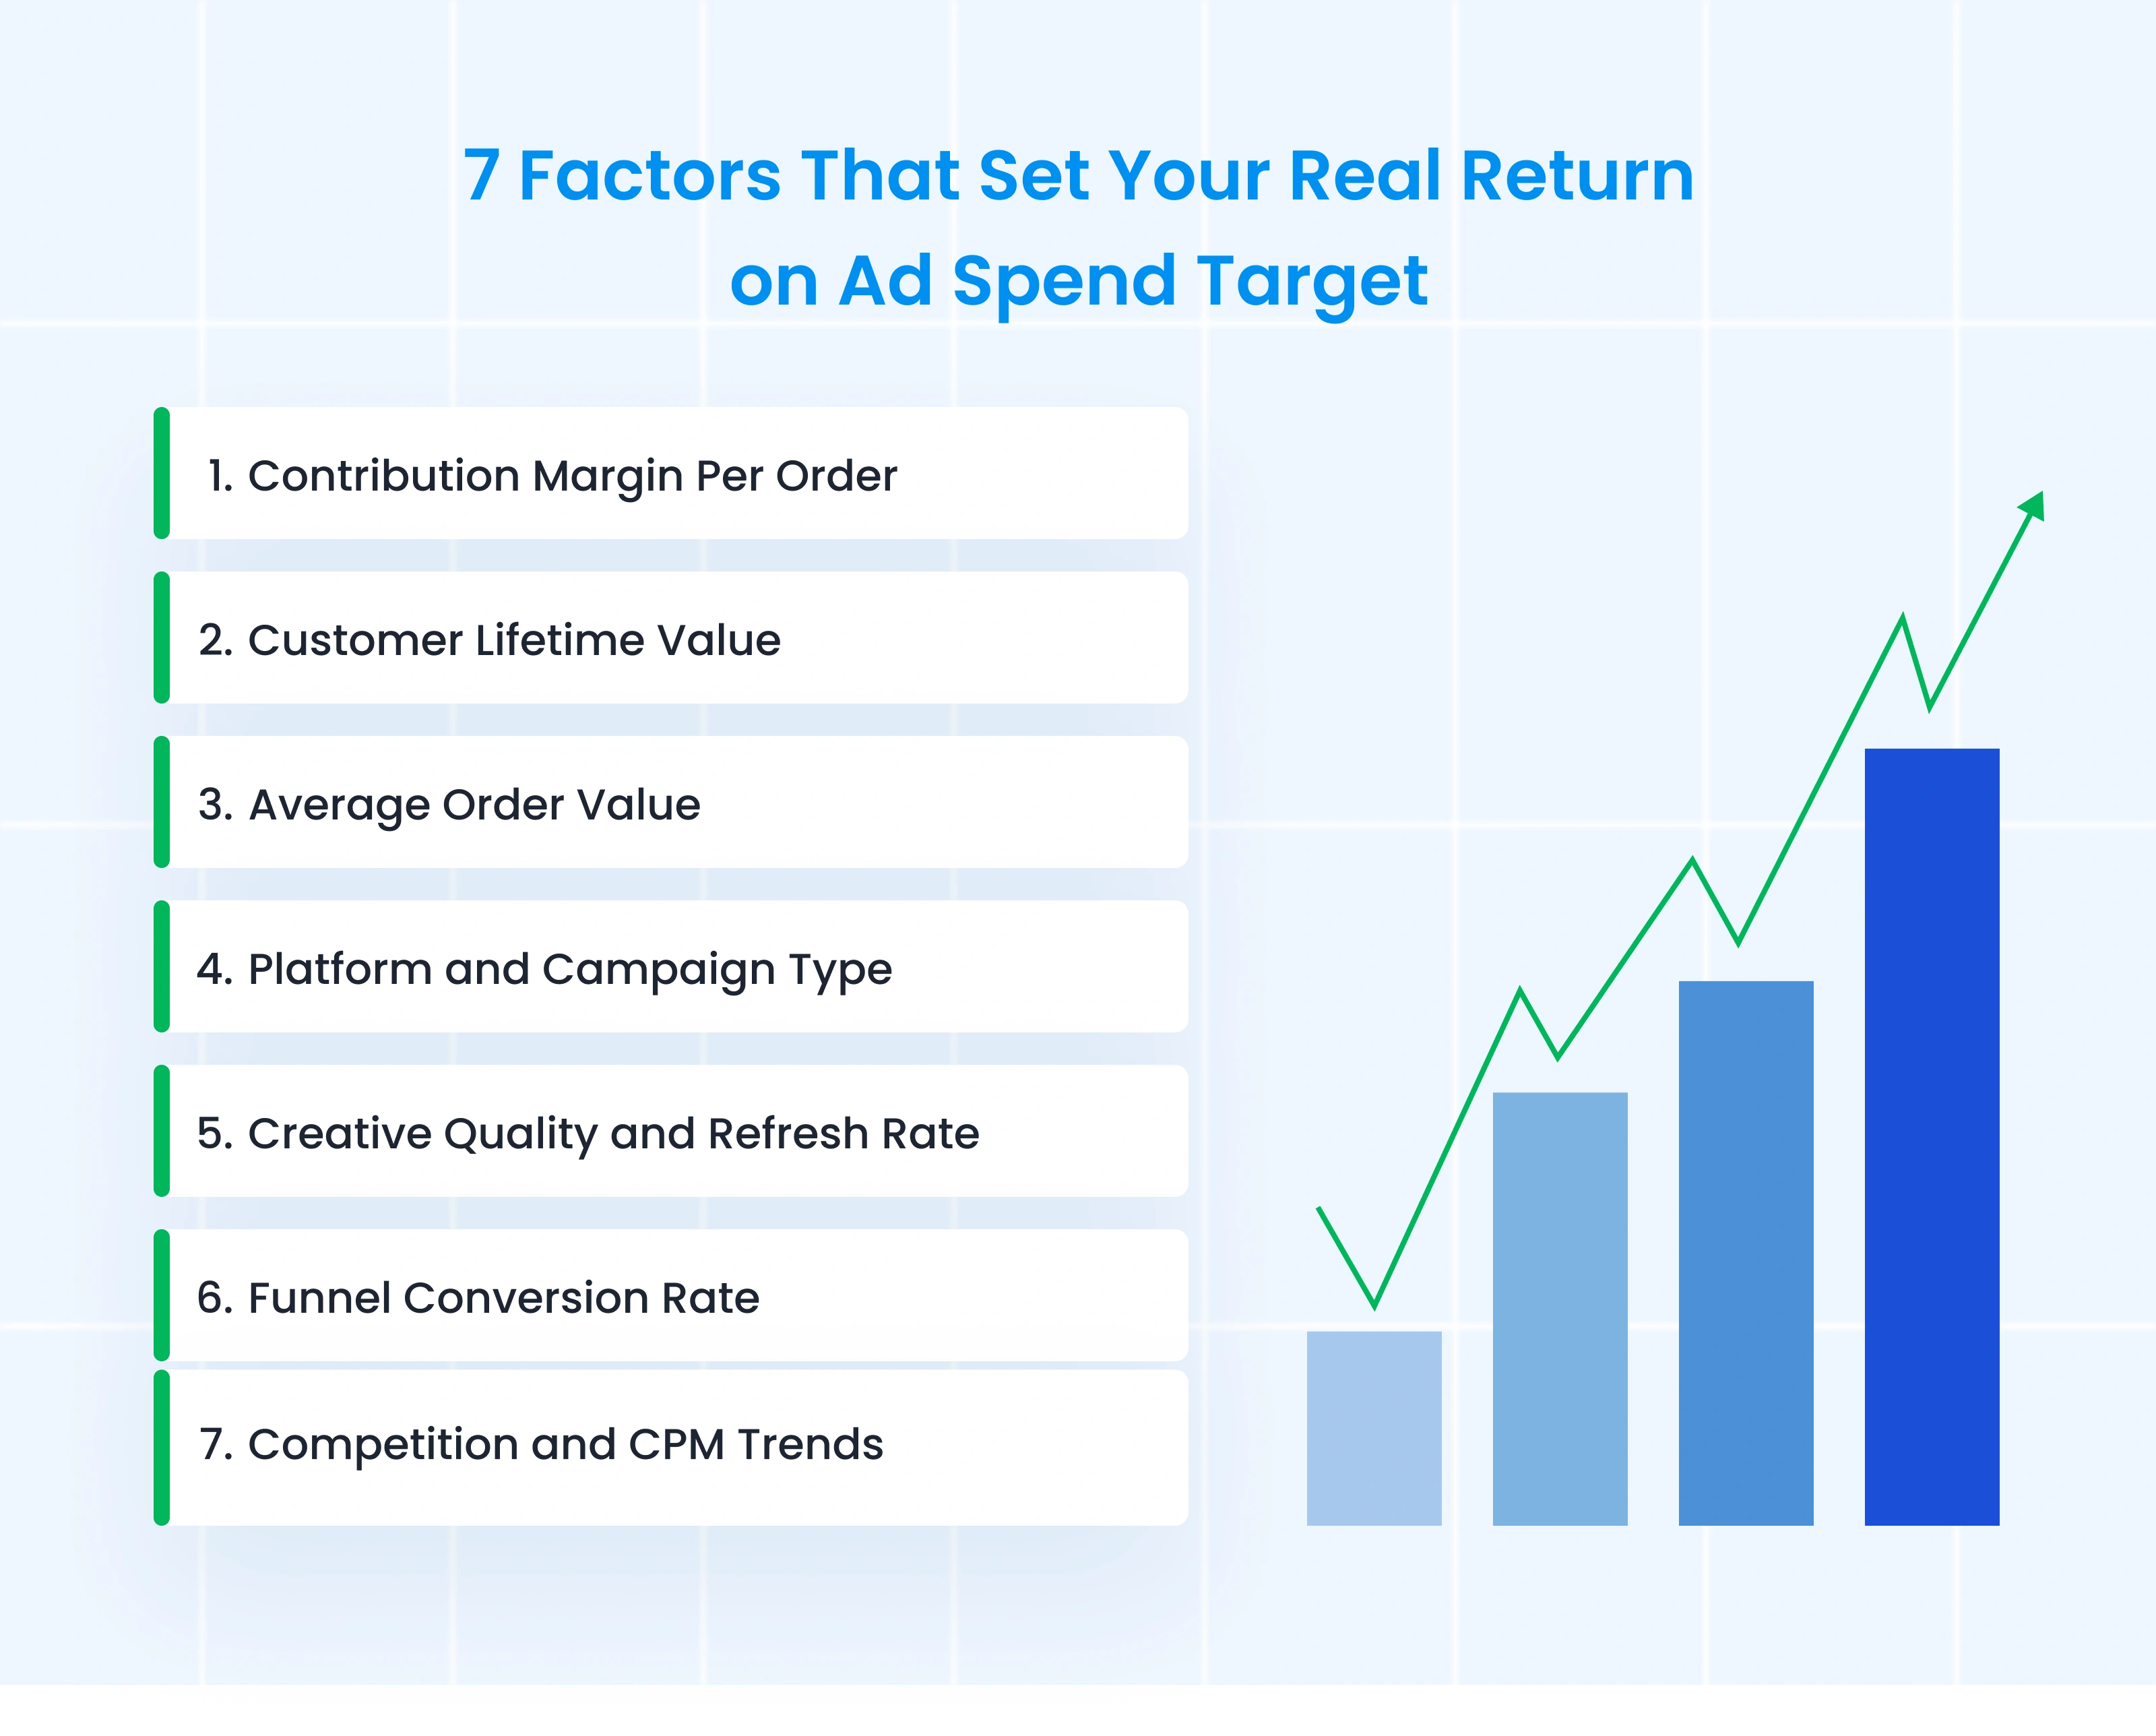
7 Factors That Set Your Real Return on Ad Spend Target
The industry benchmark is your starting point. Your actual target is somewhere above or below it, based on these 7 variables.
1. Contribution Margin Per Order
Your ROAS target is a margin math problem. Take contribution margin — revenue minus COGS, shipping, payment processing, and variable fulfillment — and divide it by revenue. That percentage tells you the maximum CAC you can absorb before a sale costs more than it earns.
A brand at 40% contribution margin can sustain a 2.5:1 ROAS. A brand at 20% needs 5:1 just to break even on paid acquisition. Most brands pick a ROAS target based on what sounds ambitious rather than what the math actually supports. That's how you scale a campaign that's destroying margin at the same time.
2. Customer Lifetime Value
LTV is the multiplier that changes what you can afford to spend on acquisition. A first-purchase customer for a premium DTC supplement like Pre Lab Pro might carry a high initial CAC — but a subscriber who reorders monthly flips that math within 2-3 cycles. When LTV is high and subscription rates are strong, a first-purchase ROAS of 2:1 can be the exact right target.
The LTV calculation that most brands use (AOV × average purchase frequency) consistently underestimates real lifetime value because it ignores the contribution margin per repeat transaction. Build the model on margin, not revenue.
3. Average Order Value
Higher AOV directly expands what you can afford per click. A $200 AOV absorbs 4x the CPC of a $50 AOV without touching margin. Tactics that lift AOV — bundles, minimum-spend thresholds, product add-ons — have compounding effects on ROAS because they raise revenue without requiring proportional spend increases.
4. Platform and Campaign Type
Search campaigns typically outperform social on ROAS because intent is already resolved. Someone searching "buy X online" is in a fundamentally different mode than someone scrolling a feed and encountering an ad. Platform selection changes your ROAS ceiling before you set your first bid.
5. Creative Quality and Refresh Rate
ROAS declines over time even when everything else stays constant. Median ROAS dropped 4.3% year over year in 2025, partly because creative fatigue is the most predictable problem and the least systematically addressed at most brands.
A testing cadence is what holds ROAS stable at scale. Ads that perform in week 1 decay as audiences see them repeatedly. Brands running 3-5 new creative tests per month hold ROAS longer than brands relying on 2-3 "proven" assets.
6. Funnel Conversion Rate
Your ad is one variable. The landing page, product page, and checkout flow are 3 more. A page converting at 1.2% versus 3.4% creates a 2.8x ROAS difference on the same ad spend. Most teams optimize the ad and ignore the rest. Using something like funnel analytics and performance reporting to understand where in the funnel you're actually losing revenue tells you which variable is worth fixing first.
7. Competition and CPM Trends
CPMs and CPCs change based on how many brands are bidding against you. A crowded supplement category in Q4 bears no resemblance to the same category in February. When CPMs rise without a corresponding lift in your conversion rate, ROAS compression follows mechanically. Pair ROAS tracking with CPM trends in your category to catch this early.
How Platform Choice Shapes Your Return on Ad Spend
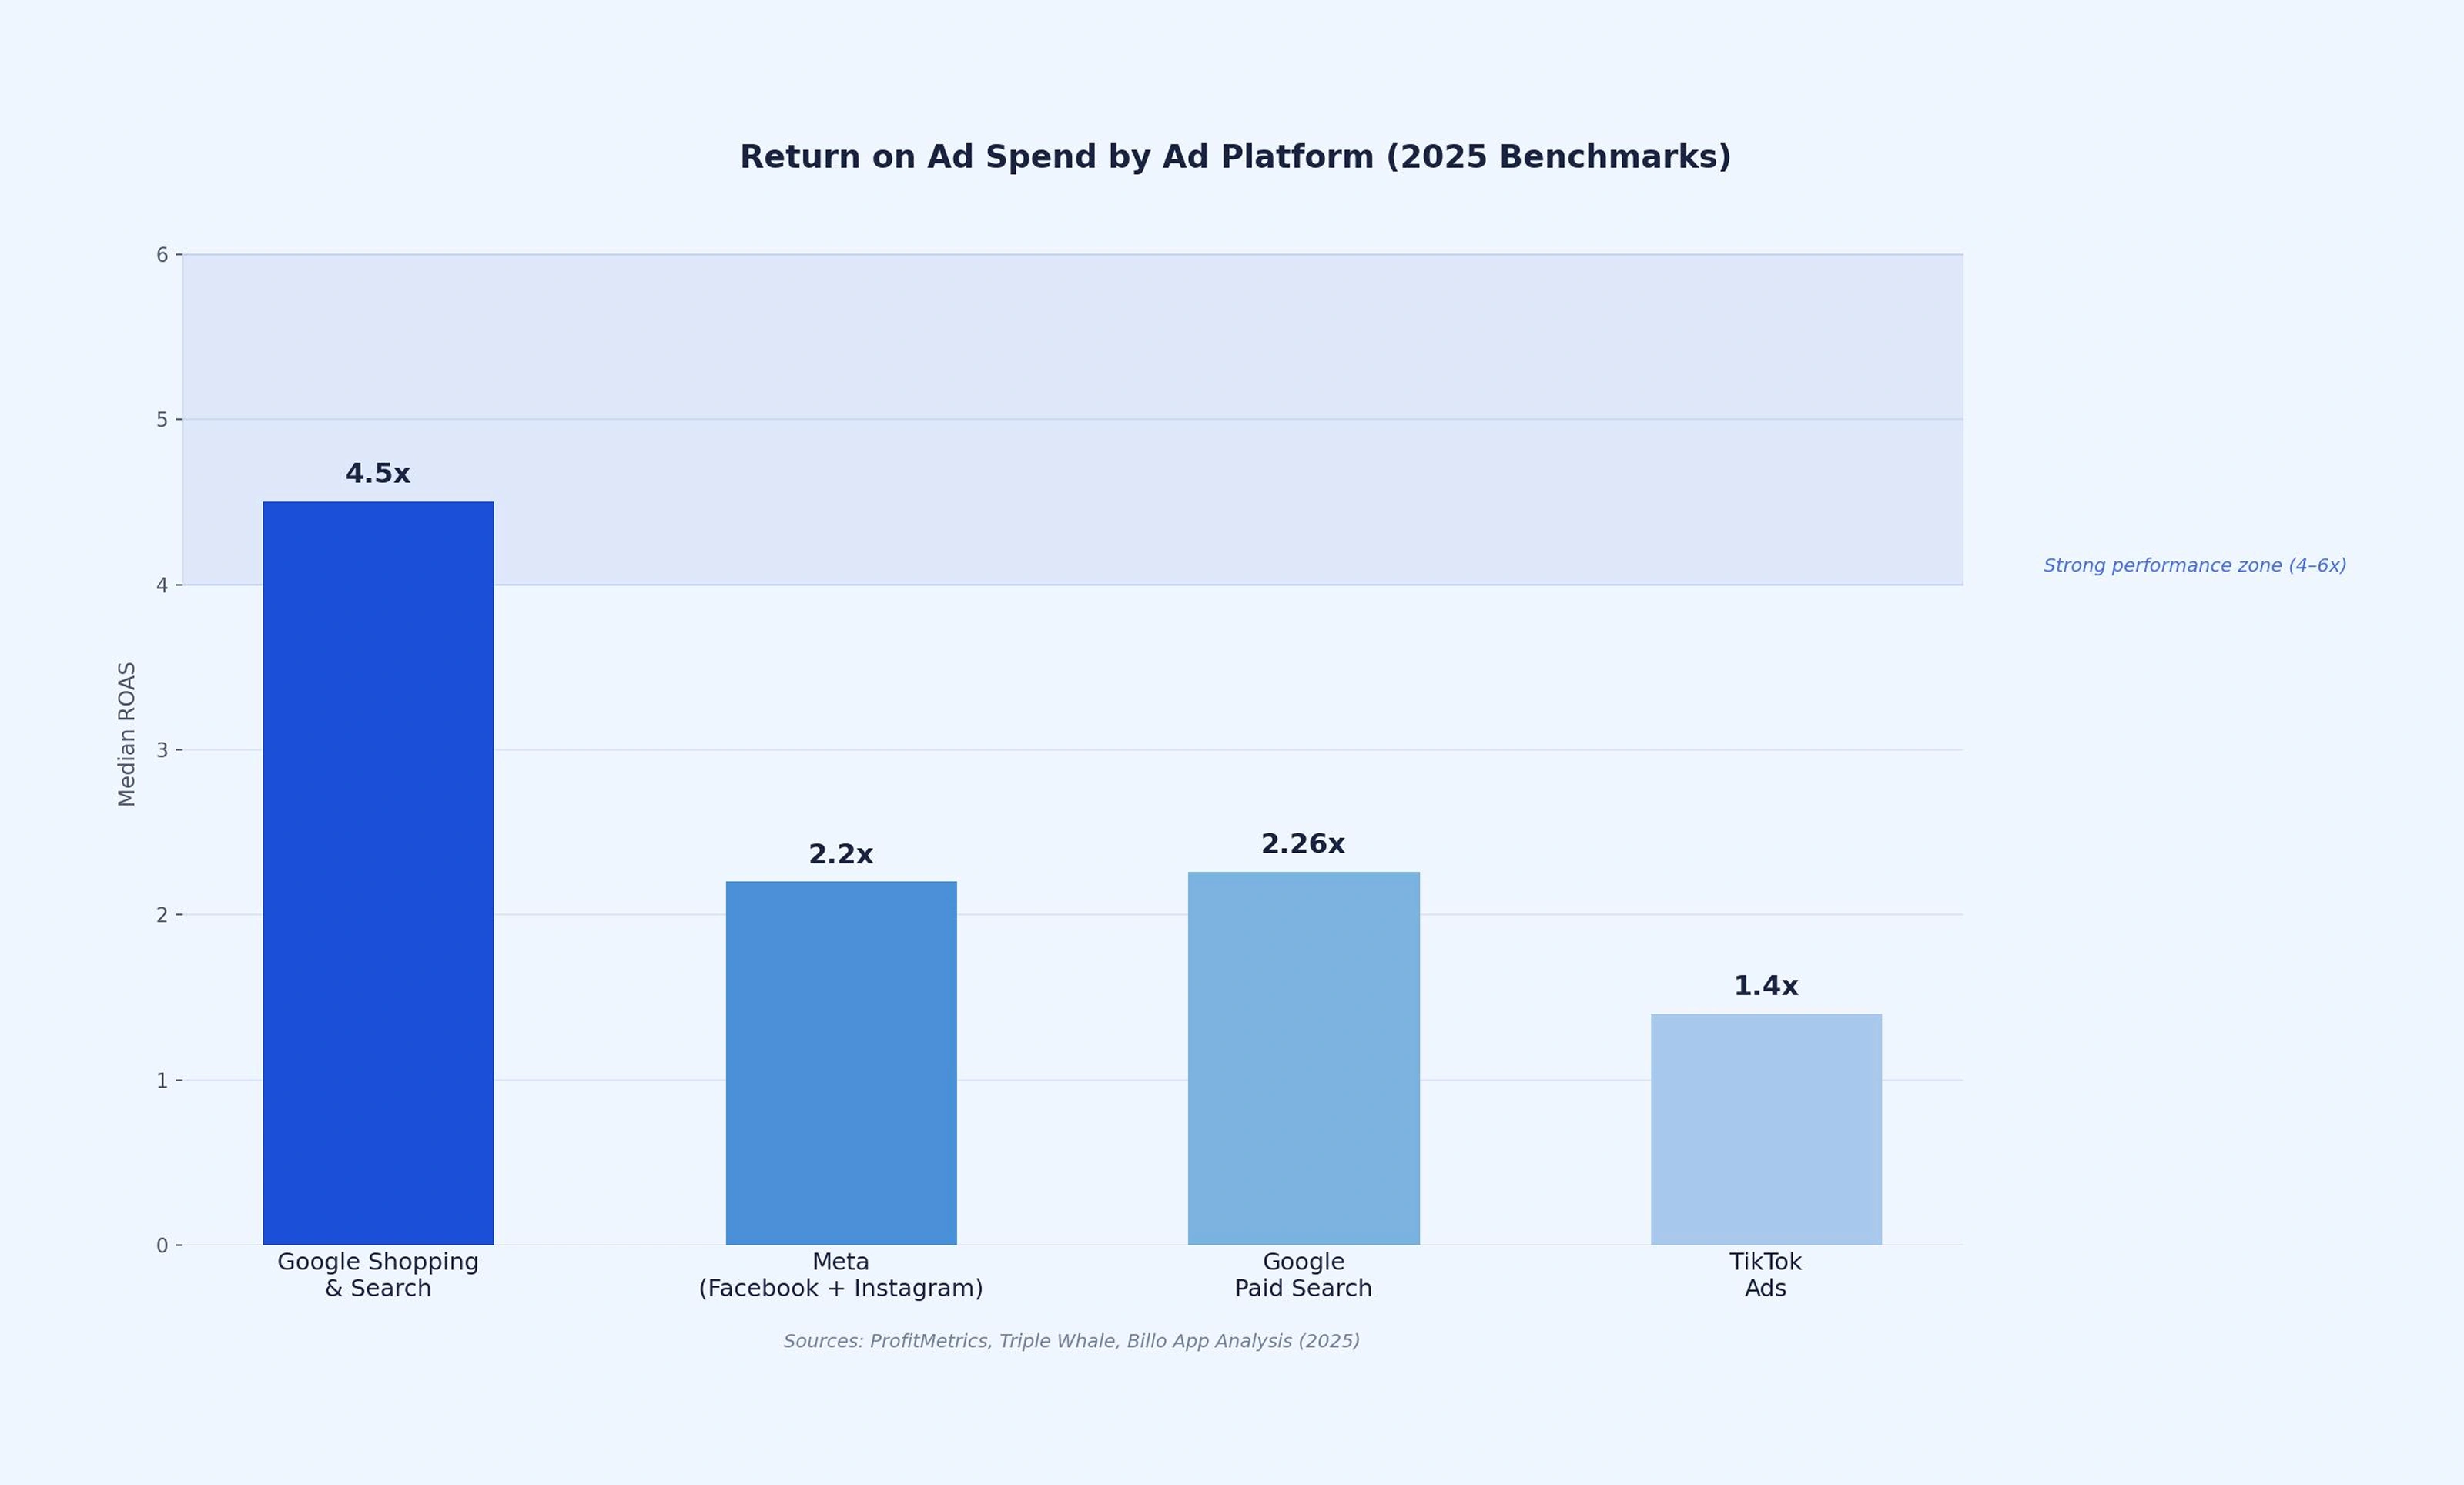
Return on ad spend by ad platform in 2025. Sources: ProfitMetrics, Triple Whale, Billo App Analysis
.
Platform selection changes your ROAS ceiling before you write a single line of ad copy. Here's where each major channel actually lands in 2025:
Google Shopping and Search:
4.5x median ROAS across eCommerce. Shopping and Search benefit from high purchase intent — users are actively looking to buy, not browsing for entertainment. Performance Max campaigns continue to compress the gap between brand and non-brand performance.
Meta (Facebook + Instagram):
2.2x median ROAS overall, but Instagram for visual product categories pushes as high as 8.83x for fashion, home decor, and fitness. The gap between Facebook feed and Instagram feed performance is significant for product-driven brands. Instagram users are in discovery mode; Facebook feed users are often in scroll-and-skip mode.
Google Paid Search (Branded + Non-Brand combined):
2.26x average ROAS across industries. Brand keywords convert at 3-5x non-brand terms and carry 3-5x higher ROAS. If you're not tracking brand vs non-brand ROAS separately, you're averaging two very different signals into one misleading number.
TikTok:
1.4x median ROAS across eCommerce, still the lowest of the major platforms. Impulse-purchase categories in apparel and beauty outperform significantly when creative fits the platform's native aesthetic, but TikTok works best as a top-of-funnel tool that feeds Google and direct conversion rather than as a standalone ROAS driver.
That matters because TikTok, Meta, Google Search, email, and retargeting campaigns rarely operate independently. A customer might discover your brand on Instagram, come back through Google Search three days later, and convert from an email sequence.
Funnelytics helps you see that path clearly with cross-platform attribution and full journey tracking, so your ROAS reporting reflects real revenue contribution instead of last-click bias.
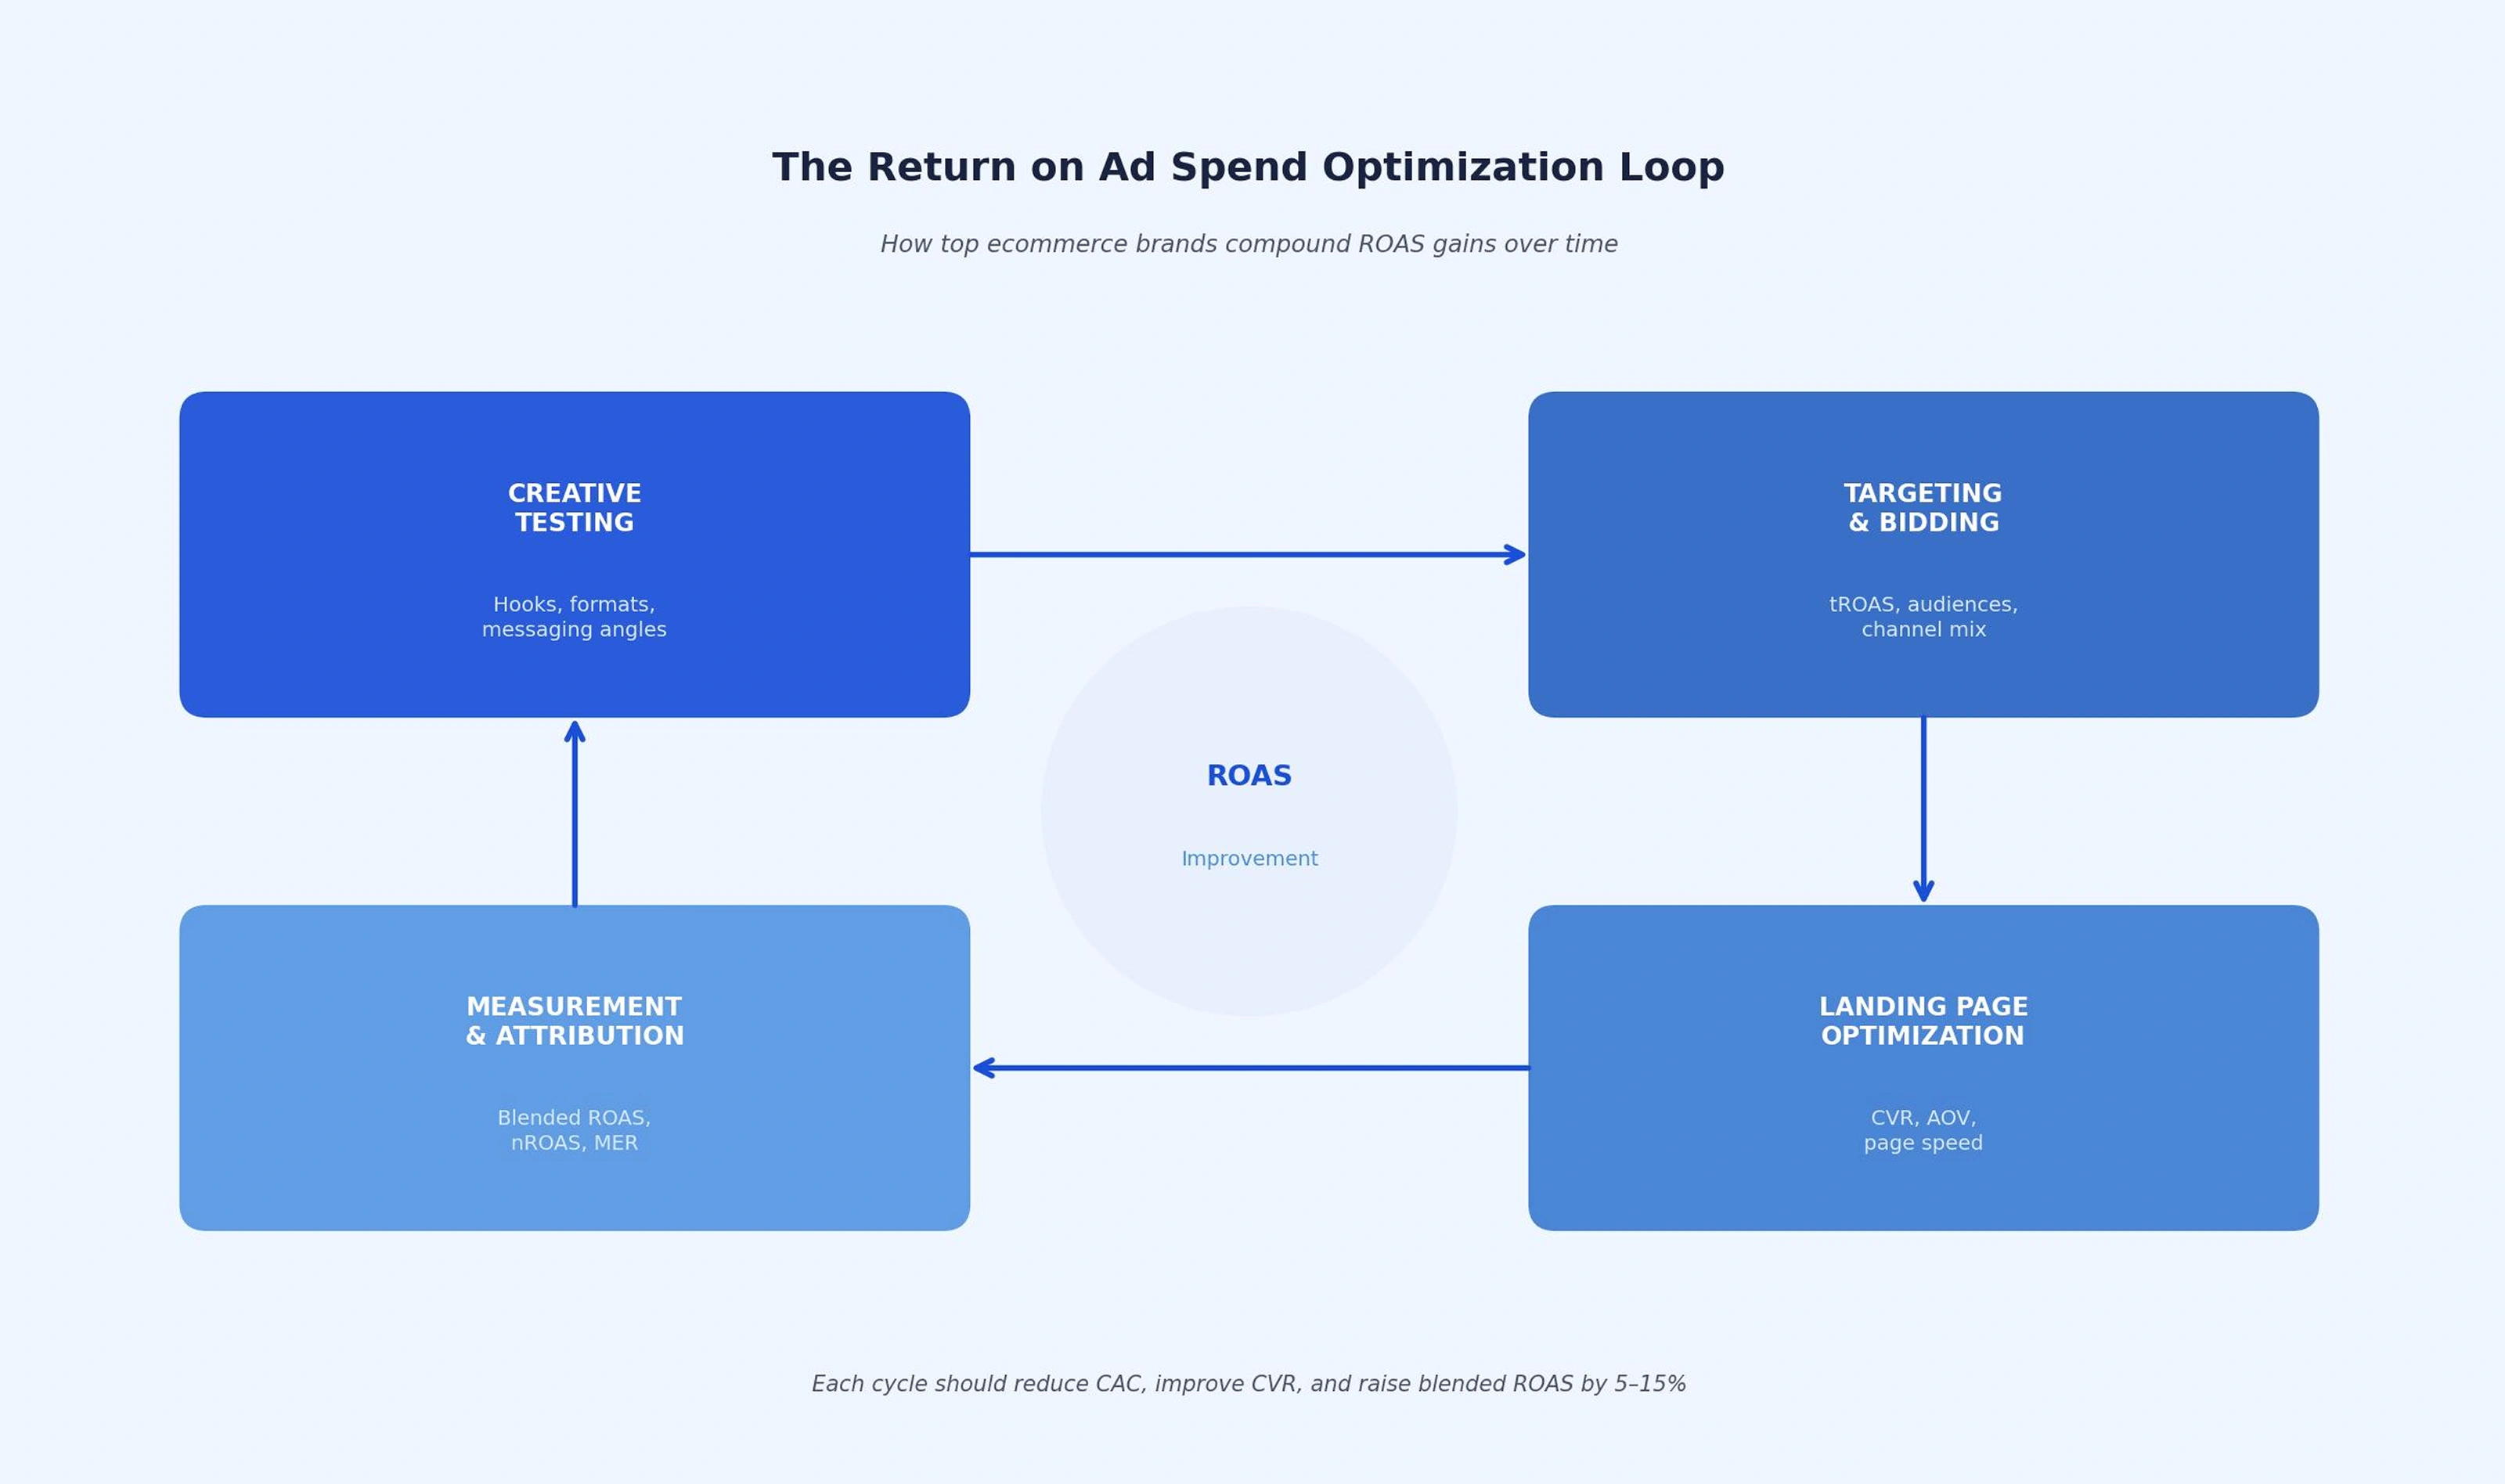
The ROAS optimization loop: how creative testing, targeting, landing pages, and measurement compound into lasting efficiency gains.
Return on Ad Spend vs the Metrics That Complete the Picture
ROAS is a campaign-level signal. It tells you if a specific ad set generated revenue relative to its cost. It doesn't tell you if you're profitable, scaling efficiently, or building anything that lasts.
These metrics together give you the full view:
The critical nuance most eCommerce teams miss: platform-reported ROAS consistently overstates actual performance because of attribution overlap. Meta and Google both take credit for the same conversion when a user saw an Instagram ad, Googled the brand, and purchased. Your true blended ROAS almost always lands 20-40% below what your ad platforms report.
MER captures the real picture. ROAS doesn't.
Run both. Use ROAS for daily tactical decisions about which ad sets to scale, pause, or test. Use MER as the weekly leadership metric that tells you whether the whole paid acquisition machine is healthy.
Your 30-Day Return on Ad Spend Improvement Sprint
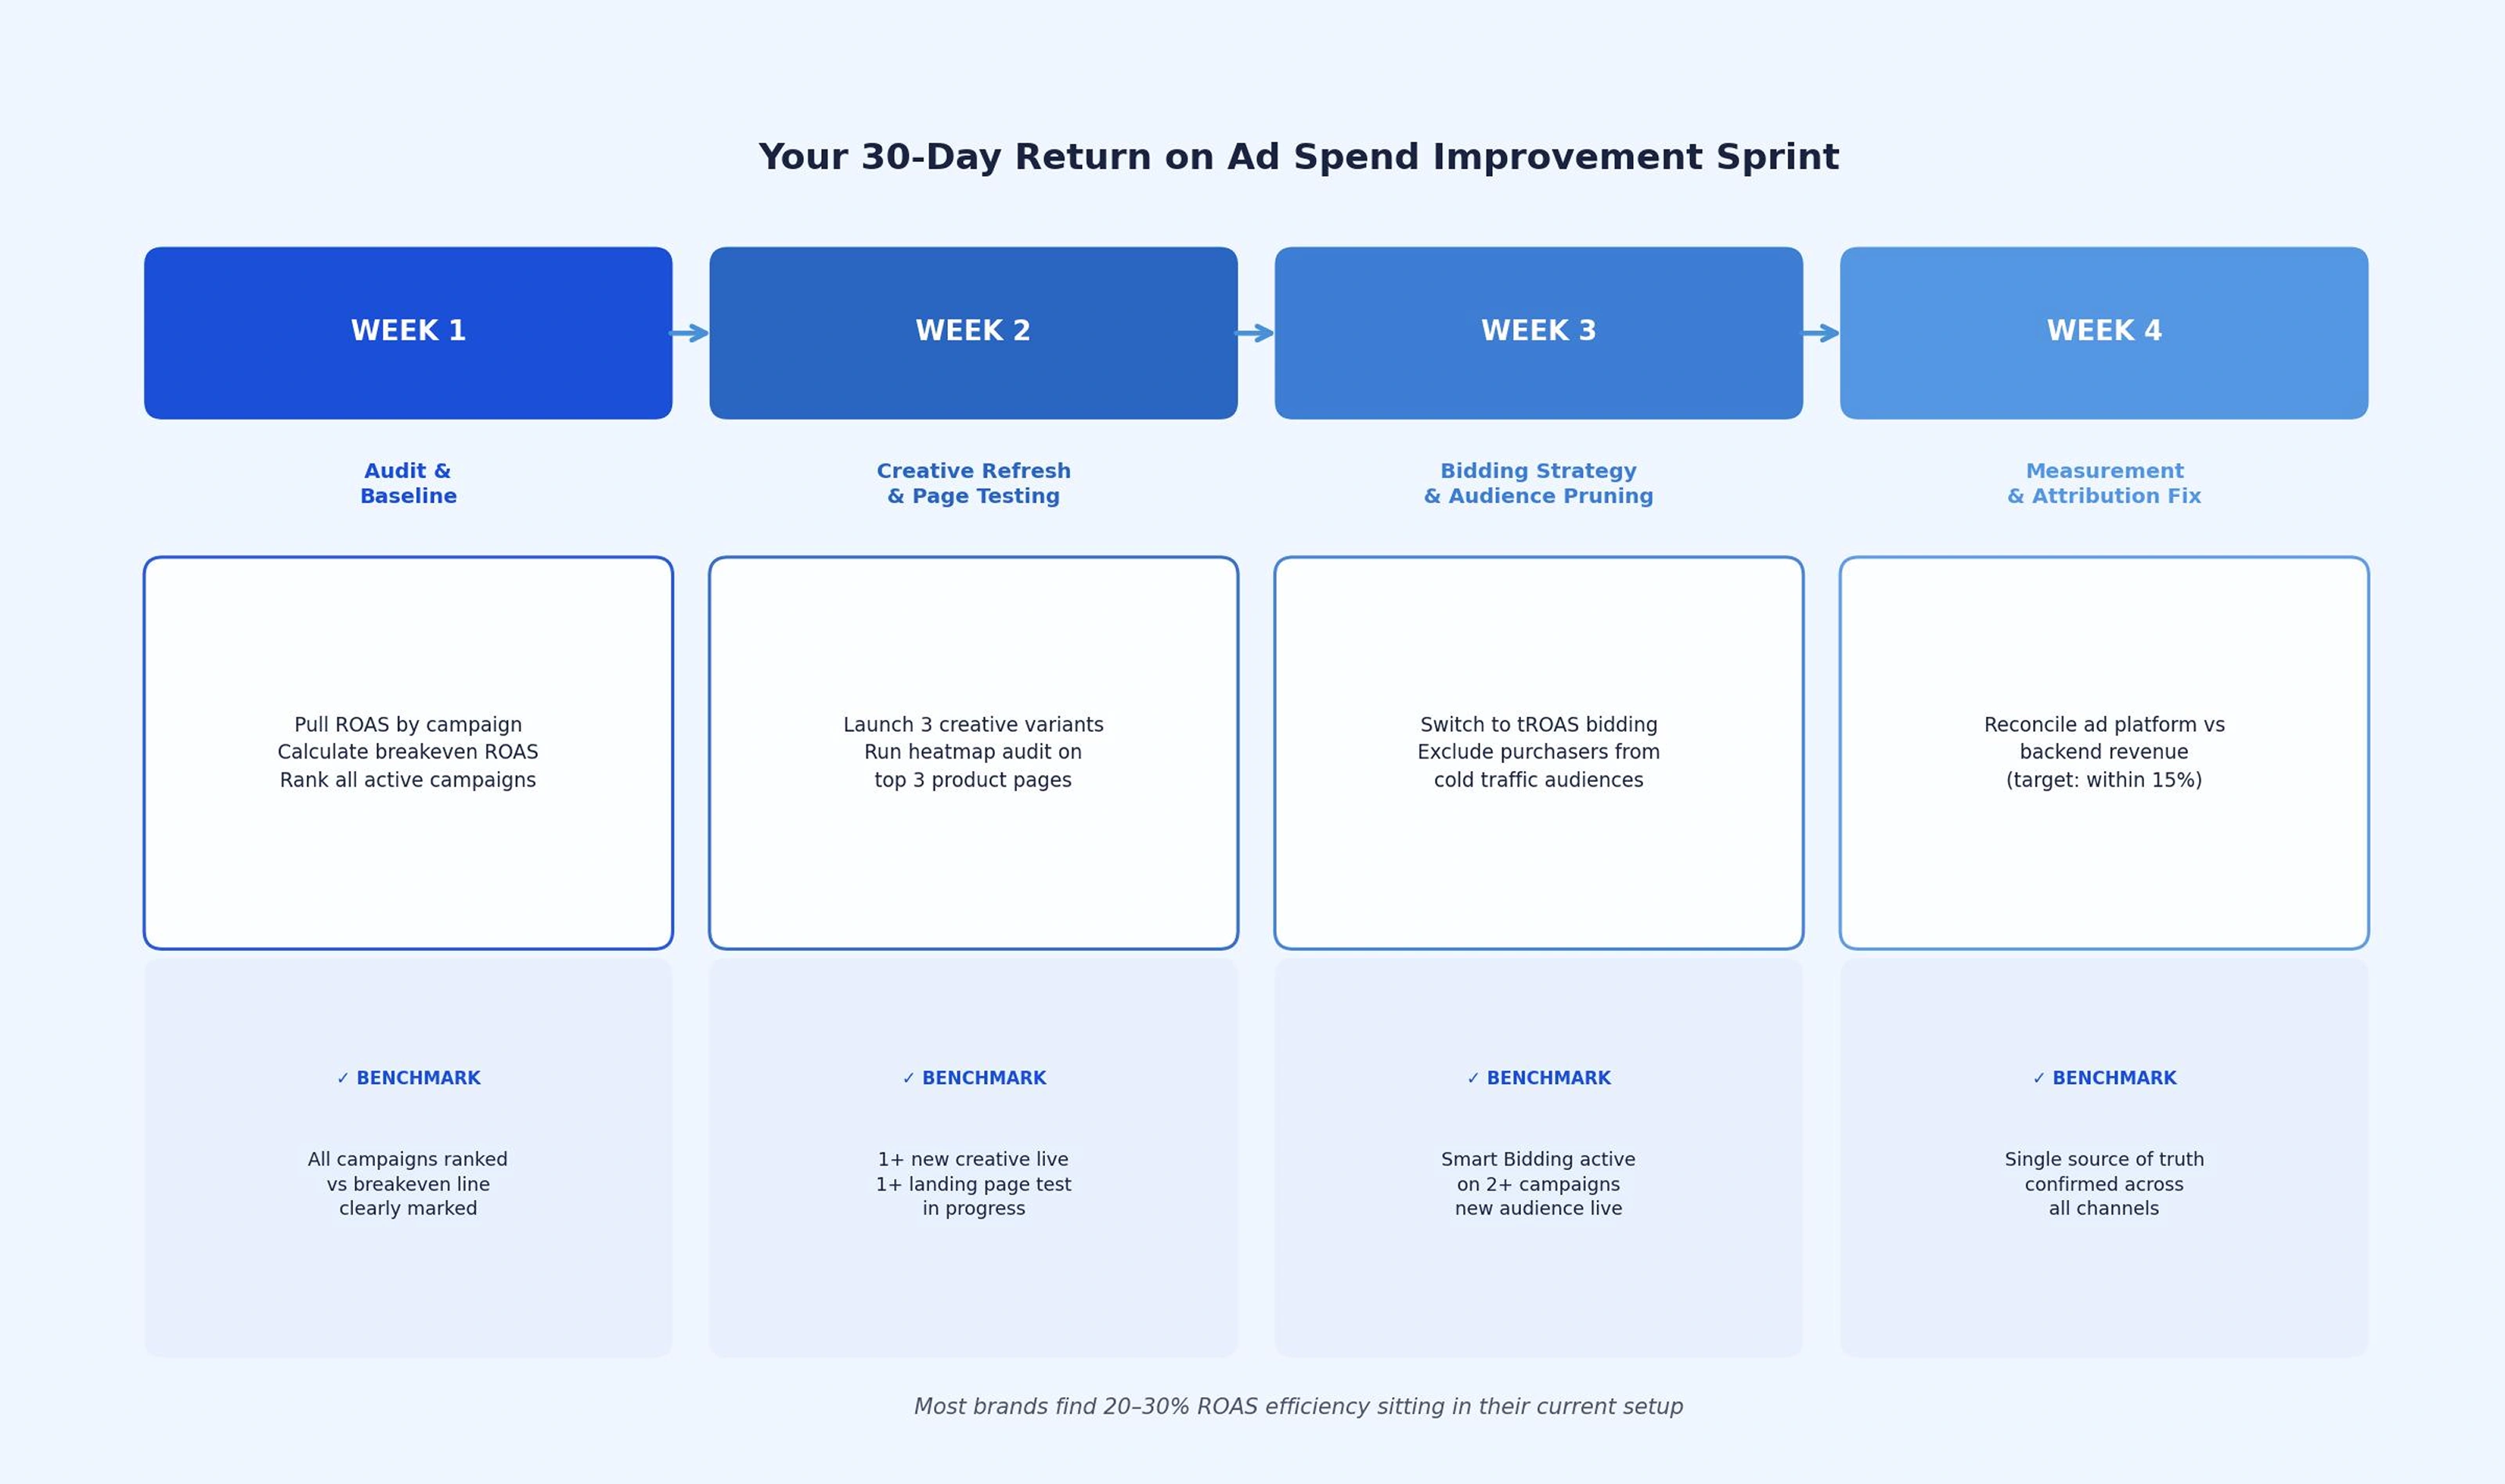
A 4-week ROAS improvement sprint built around compounding efficiency, not campaign rebuilds. Most brands recover 20–30% efficiency from their existing setup.
Most brands have 20-30% efficiency sitting in their current campaigns, hiding in weak landing pages, untested creative, and mis-set bidding strategies. You don't need a rebuild to find it.
Week 1: Audit and Baseline
Pull ROAS by campaign, by channel, and by product category. Calculate your actual breakeven ROAS using your current contribution margin percentage. Flag every active campaign running below that threshold. Those are the money losers funding campaigns you haven't fully proven yet.
Produce a ranked list of all active campaigns by ROAS with the breakeven line clearly marked. That single view shows where you're destroying margin and where you're under-investing in what's already working.
- Benchmark: By the end of Week 1, every active campaign ranked by ROAS against your breakeven line, no exceptions.
- Common trap: Pulling ROAS from a 7-day window during an anomalous period. Use 30-day trailing ROAS for this baseline, not last week.
Week 2: Creative Refresh and Landing Page Testing
Pick your 3 top-spend campaigns and launch 2-3 new creative variants per campaign. Focus on the hook first – the first 3 seconds of video and the first line of ad copy. The hook determines whether someone engages. Everything else is secondary.
On the landing page side, run a heatmap audit on your top 3 product pages using Hotjar or Microsoft Clarity. Find the drop-off point and test one element per page. Headline, hero image, CTA copy, and review placement are the highest-leverage variables.
- Benchmark: At least 1 new creative variant live and 1 landing page test running by the end of Week 2.
- Common trap: Testing too many elements simultaneously. A winning test tells you nothing if 5 things changed at once.
Week 3: Bidding Strategy and Audience Pruning
Switch campaigns still running manual CPC to Smart Bidding with a Target ROAS goal set 10-15% below your current actual ROAS. This gives the algorithm room to optimize toward your target without immediate budget shutdown from over-aggressive goal-setting.
Prune audiences. Exclude purchasers from cold traffic campaigns, add 14-day cart abandoners to retargeting audiences, and build a lookalike off your top-25% LTV customers rather than all purchasers. The LTV-based lookalike almost always outperforms the all-purchaser lookalike by 15-30% on nROAS.
- Benchmark: Smart Bidding live on at least 2 campaigns and 1 new audience segment in the learning phase.
- Common trap: Setting tROAS too aggressively. A campaign averaging 3:1 with a tROAS goal of 8:1 kills delivery within 48 hours. Start 10-15% above current ROAS, then ratchet up weekly as the algorithm learns.
Week 4: Measurement and Attribution Cleanup
Check attribution settings across all channels. Are Meta and Google both counting the same conversion? Are view-through conversions inflating reported ROAS beyond what's real? Set a single source of truth and reconcile it against the ad-platform-reported revenue. Most brands find 20-35% inflation between reported and actual attributed revenue.
Good marketing funnel optimization work at this stage means closing the measurement gap so you stop making bid decisions based on inflated attribution data.
This is also the stage where many eCommerce teams realize the problem is no longer isolated to one ad account or one platform. Search, paid social, retail media, creator campaigns, and retention flows operate on separate reporting systems with different attribution logic attached to each channel.
Partnering with an eCommerce marketing agency here helps unify those moving parts into a more coordinated performance system, especially when ROAS decisions depend on how Meta, Google, Amazon, influencer campaigns, and retention channels interact together rather than how each platform reports performance independently.
- Benchmark: Ad-platform ROAS and backend revenue reconciled within 15% of each other. Anything beyond that gap means your campaigns are optimizing toward a number that doesn't reflect real business performance.
- Common trap: Accepting platform-reported ROAS as ground truth. Every major ad platform over-reports. The question is only by how much.
5 Metrics That Prove Your Return on Ad Spend Is Improving
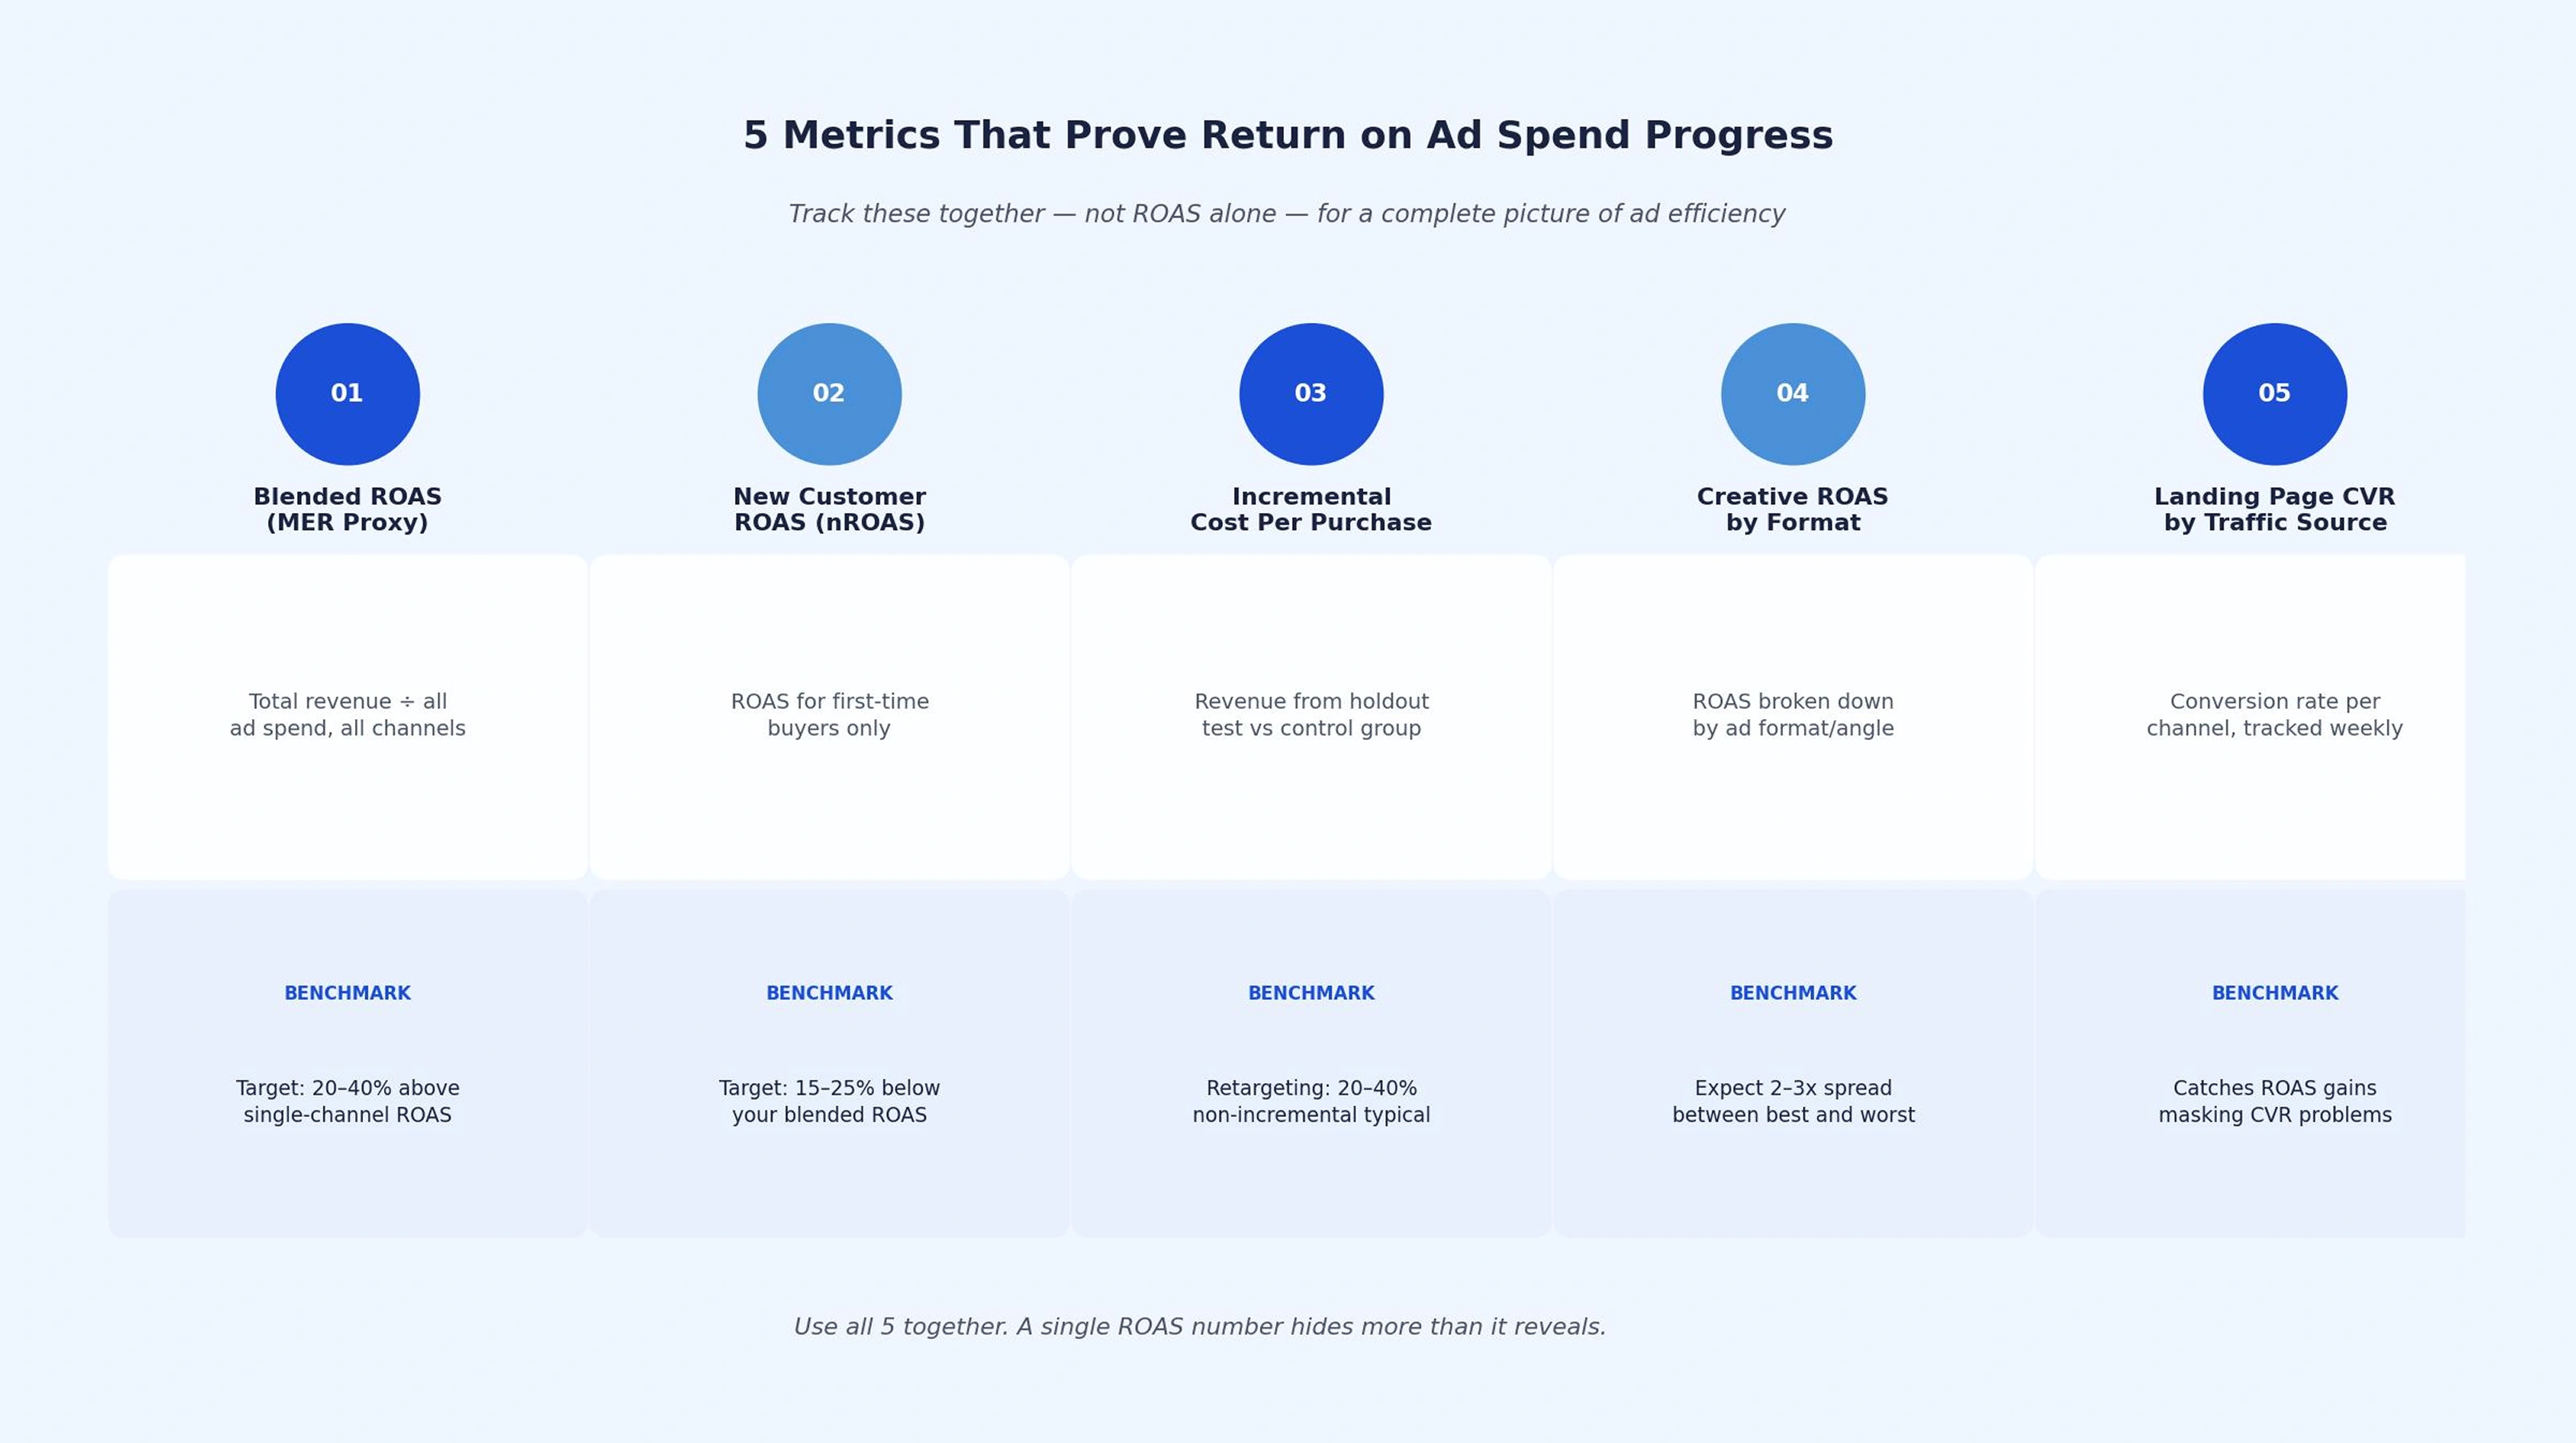
The 5 ROAS metrics that matter most for eCommerce brands tracking end-to-end ad efficiency.
Tracking ROAS alone creates blind spots. These 5 metrics together give you the picture that a single channel number can't.
1. Blended ROAS (MER Proxy)
Total store revenue ÷ total ad spend across all channels. This is the number that tells you whether your overall paid media operation is healthy, regardless of how individual platforms report. A healthy blended ROAS for a growth-stage eCommerce brand typically sits 20-40% higher than any single channel's reported figure.
2. New Customer ROAS (nROAS)
ROAS calculated only for first-time buyers, excluding repeat purchasers. This is the honest acquisition efficiency metric. A high overall ROAS propped up by retargeting existing customers masks a weak top of funnel. Most brands should set nROAS targets 15-25% below their blended target, acknowledging that new customer acquisition costs more.
3. Cost per Incremental Purchase
Run periodic holdout tests where you withhold ads from a control group and measure the revenue difference. This is the only method that reveals how much of your attributed ROAS is actually incremental versus what would have converted organically anyway.
Most brands find that 20-40% of retargeting revenue is non-incremental. That's the budget that could be redeployed toward real acquisition.
4. Creative ROAS by Format and Angle
Break ROAS down by creative type: static image, video, UGC, testimonial, product demo. You'll almost always find a 2-3x spread between your best and worst performing formats. That spread is where the next 6 months of creative investment decisions should go. Focusing on what's already winning at the format level beats endless testing of what isn't.
5. Landing Page Conversion Rate by Traffic Source
An ad-level ROAS improvement can hide a downstream problem. A campaign showing ROAS gains through higher CTR might be sending worse-intent traffic to your page and masking the issue with volume. Track CVR by traffic source weekly alongside ROAS to catch this before it erodes real margin.
Paid media teams running dozens of active campaigns across multiple channels need operational infrastructure that keeps testing cycles, handoffs, and measurement documentation organized.
Teams evaluating project management alternatives and migrating off Jira Data Center as Atlassian's on-premises support winds down through 2029, find the migration window is a natural moment to restructure how paid media workflows are tracked between creative, media buying, and analytics functions. Operational tightness at the team level directly affects how quickly ROAS improvements get implemented and measured.
The Brands That Build Lasting Return on Ad Spend Efficiency
Return on ad spend benchmarks tell you where you stand in your vertical. Closing the gap between your current number and the top quartile comes down to 3 habits done consistently: measuring at the blended level rather than just campaign level, refreshing creative before fatigue sets in, and treating the landing page as part of the ad system rather than a separate conversion problem.
Brands that build those habits and tie them to structured team-level targets compound returns over quarters while competitors chase weekly fluctuations in their ad platform dashboards.